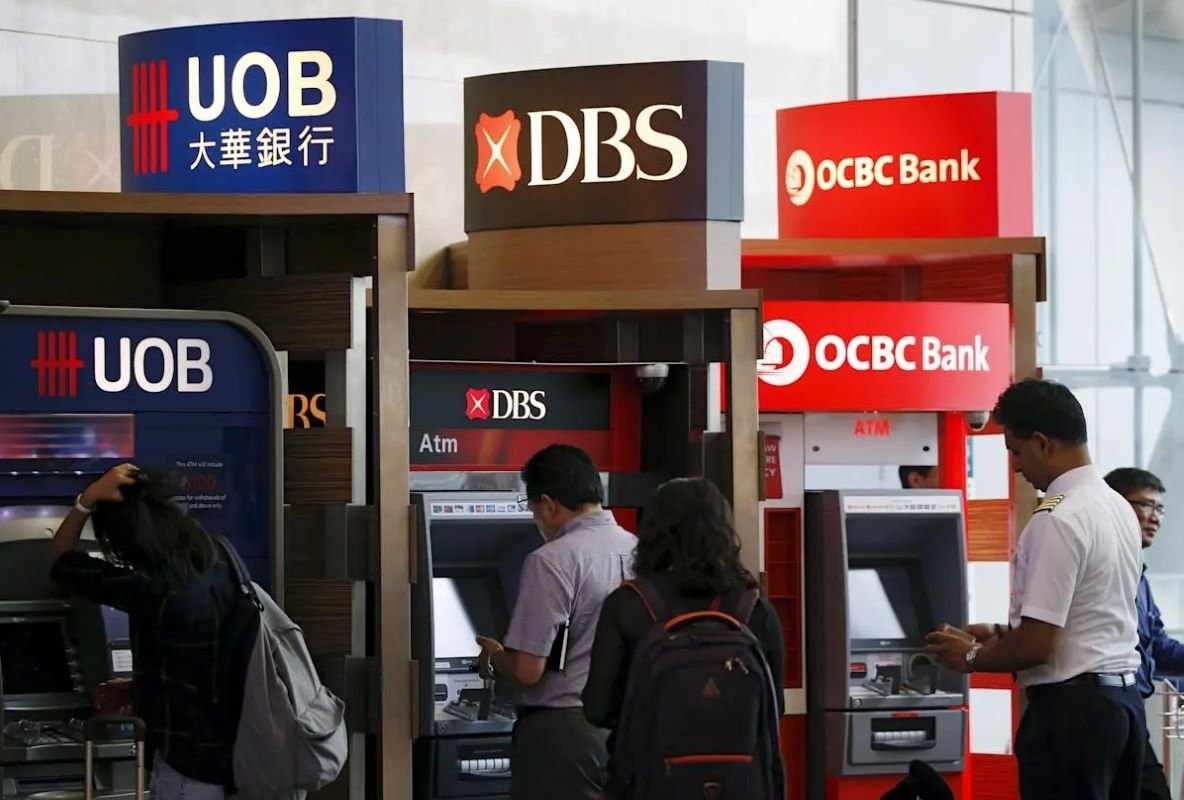
For more than 12 hours over the October 14-15 weekend, customers of DBS – Singapore’s largest bank – were unable to access digital banking and ATM services, after an Equinix-run data centre used by DBS was hit by a power outage. The last time DBS’ digital banking services faced a similar length of downtime was in March this year.
The recent outage follows disruptions to bank transfer services PayNow and FAST for DBS customers on September 26, and was followed by access issues with DBS’ mobile payment app PayLah! on October 20 for around two hours.
But to what extent has consumer perception of DBS been impacted by this recent string of service disruptions?
Latest data from YouGov BrandIndex shows that Buzz scores for DBS (which measures whether consumers have heard more positive or negative things about a brand in the past two weeks) plunged 18 points after the recent outage, from 23.8 on October 14 to 5.8 by October 16.
It entered negative territory by October 20, a day after financial regulator MAS ordered DBS to conduct a “thorough investigation” on the outage and warned of supervisory action, and fell to -9.5 by October 21, a day after service disruptions to the DBS PayLah! mobile payments app.
However, DBS’ net scores for Impression (which track the general impression consumers have towards a brand) and Satisfaction (which track whether a brand’s customers are mostly satisfied or dissatisfied with it) did not see a drastic slump.
Consumer impression of DBS – which had grown significantly from 36.4 on September 23 to 51.3 on October 14 – saw a clear drop immediately after the recent outage. But by October 23, it returned to largely similar levels as a month ago.
Meanwhile, customer satisfaction with DBS – which saw a smaller uptick from 37.8 on September 23 to 41.0 on October 14 – also declined shortly after the overnight disruptions, but recovered to 40.6 by October 23.
Notably, there was no significant decline in the percentage of consumers who would consider banking with DBS, over the week following the outage. DBS’ Consideration scores (which track the percentage of consumers who would consider purchasing from a brand when they are next in the market for its products/services) dipped just 2.8 points from 40.1 on October 14 to 37.3 by October 23.
Indeed, DBS’ Index score (an overall measure of brand health calculated as an average of Impression, Quality, Value, Reputation, Satisfaction, Recommendation scores) of 35.8 on October 23 remains markedly higher than its major local rivals OCBC (18.5) and UOB (20.1), as well as digital challenger Trust Bank (20.5), which is backed by Singapore’s sole national trade union centre.
But with dual investigations into DBS’ earlier PayNow and FAST transfers disruption as well as the recent outage underway that saw some merchants report up to 10% losses in sales revenue – and the possibility of impending regulatory action, given that the bank has exceeded the 4-hour ceiling for unscheduled downtime in bank operations within a 12-month period set by MAS – how will consumer perception towards DBS change in the coming weeks? YouGov BrandIndex’s daily tracking of the brand will allow interested parties to see just how much – and how soon.
How was OCBC’s brand impacted by the December 2021 phishing scam? Read our earlier article here.
Methodology: YouGov BrandIndex collects data on thousands of brands every day. Buzz scores are based on the following question: “Over the past two weeks, which of the following brands have you heard something positive/negative about (whether in the news, through advertising, or talking to friends and family)?" (Net score). Impression scores are based on the following question: “Overall, of which of the following brands do you have a positive/negative impression?” (Net score). Satisfaction scores are based on the following question: “Of which of the following brands would you say that you are a satisfied/dissatisfied customer?” (Net score). Consideration scores are based on the following question: "When you are in the market next to purchase financial services, from which of the following would you consider purchasing?” (% yes). Figures are based on a 1-week moving average. Index scores, an overall measure of brand health, are an average of Impression, Quality, Value, Reputation, Satisfaction, Recommendation scores. Learn more about BrandIndex.


